Requirements: minimum 200-word response
Category: Databases
-
Week 5 Peer Responses
Respond to two of your classmatesthreads with posts of at least 100 words discussing their comments and ideas.Try to ask open-ended questions that encourage discussion and remember torespond to people who post on your thread.
Requirements: minimum 100-word response to both peer
-
EER Design for a Delivery System
Need help creating an EER diagram (ER notations not UML). Must include entities, attributes, PKs, relationships, cardinality, participation constraints, and specialization (overlapping + total for Person Student/Faculty/Staff).
Requirements: Detailed
-
Everything provided below
You have been tasked with designing a data model for UniFit, a newly established wellness and fitness center in the UAE. UniFit offers a variety of services, including gym training, group fitness classes, personal training sessions, and nutrition consultations.
The management requires a database system to manage member registrations, service bookings, trainer schedules, room allocations, and attendance tracking. You conducted an interview with the operations manager and collected a sample booking record to identify key data requirements. The interview is shown in Figure 1. The sample service booking example customer is shown in Figure 2.Figure 2: Unifit service booking
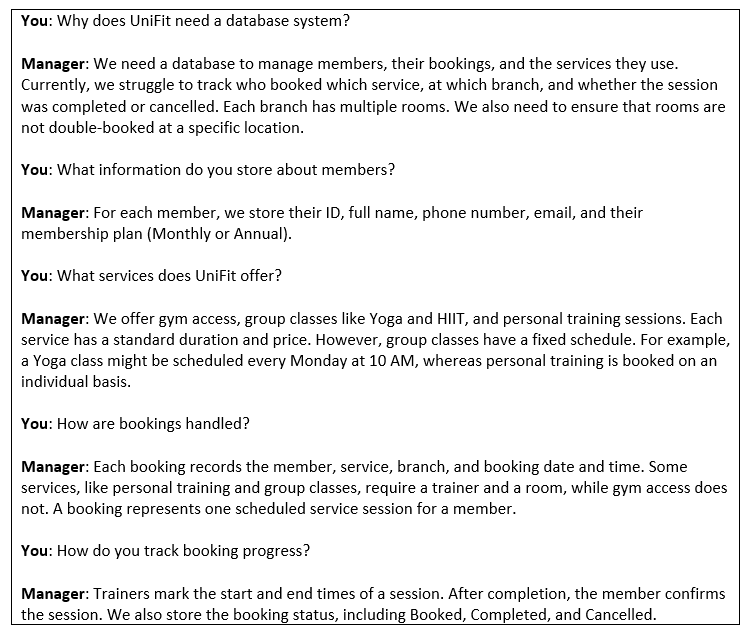 Figure 2: Unifit service bookingRequirements
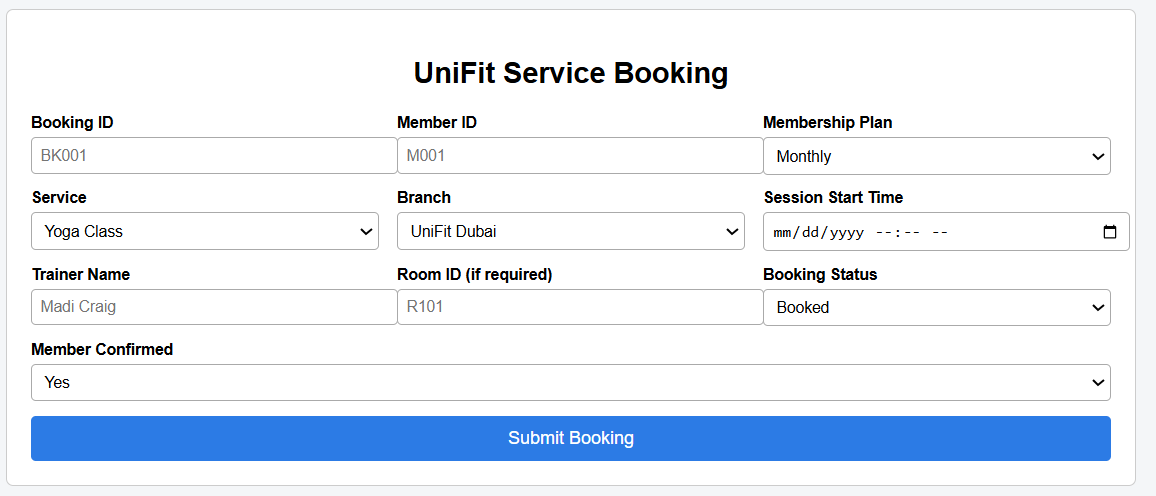
Based on the interview in Figure 1 and the sample booking in Figure 2, complete the following:
1. Additional Interview Questions
- Propose additional interview questions that would help gather more data requirements for the system to help identify relationships, attributes or deletion rules.
2. Identify Subjects (Tables)
- Extract a list of subjects (tables).
- Clearly document how each table was identified from the interview and booking sample (e.g., underlining or highlighting).
- Remove any duplicate table names.
3. Identify Characteristics (Fields)
- Extract the list of characteristics (fields) for each table.
- Remove duplicate fields where applicable.
4. Table Structures
- Create table structures showing table names and their associated fields.
- Clearly identify primary keys and foreign keys.
- Provide a short description for each table.
5. Populate Tables
- Populate each table with three realistic records.
6. Normalization (Up to 3NF)
- Ensure all tables are normalized up to Third Normal Form (3NF).
- Provide a clear justification explaining how 1NF, 2NF, and 3NF are achieved for each table.
7. Relationship Matrix
- Create a relationship matrix.
- Justify each relationship by explaining:
- Relationship type.
- Participation type and degree.
- Foreign key specification forms.
8. Entity-Relationship Diagram (ERD)
- Draw an ER diagram showing:
- Entities and attributes
- Relationships
- Participation types and degrees
- Deletion rules
Justify your deletion rules choices.
Submission
Submit a report (single PDF file) that contains all the above requirements.
(Please be advised that submitting more than one file or an external link to an ERD or a Google Document will result in a reduction in your grade.)
Instructions for Students
- You may use AI tools (such as ChatGPT or Gemini or any other) to help answer the questions. You must only utilize the data modeling concepts that have been taught in class so far to receive complete credit. Answers with advanced concepts not covered in the course will get a score of 0. In addition, you must understand every single line of your submitted work. Please be prepared to explain your work, as you might be called for a technical interview to explain your answers. The extent to which you know the answer will be used to evaluate the assignment. If you have used an AI tool (e.g., ChatGPT, Gemini …), please submit all the prompts (screenshots) you used to help you in this assignment.
- Make sure that you submit your own original work. Suspected plagiarism cases will be treated as possible academic misconduct and will be reported to the College Academic Integrity Committee for formal investigation. As part of this procedure, your instructor may require you to meet with them for an oral exam on the assignment.
- Failure to comply with the instructions will result in a 0 grade on the relevant portions of the assignment. Your instructor will grade your submission based on what you submitted on the Forum within the allowed deadlines. Do not submit your assignment via email. Failure to submit an assignment or submitting an assignment for another student from the same class or another class will result in a 0 grade without the opportunity to resubmit.
- Clearly list any assumptions you have made about concepts not explicitly mentioned in the assignment.
Assignment Information
Learning Outcomes Added
- : Design a data model that is accurate, complete, and fulfills the system requirements.
- : Apply data normalization concepts to structure the data and reduce redundancies
Requirements: n/a
-
Databases Question
Choose one real-world scenario below and design one database table for it.
Scenario Options (Choose One)
- Patients in a clinic
- Students enrolled in a university
- Employees at a company
- Products sold by a store
Part 1: Design Your Table
Create one table with:
- A clear table name
- 46 columns
- One primary key
Example (structure only):
Column Name
Description
StudentID
Unique identifier for each student
FirstName
Students first name
LastName
Students last name
Major
Academic major
Email
Student email
(Your table and columns will vary based on the scenario you choose.)
Part 2: Identify the Primary Key
Answer the following:
- Which column is your primary key?
- Why is this column a better primary key than:
- A name?
- An email or phone number?
Part 3: Reflection
In 35 sentences, respond to:
- What problems could occur if your table did not have a primary key?
- Why are primary keys especially important as databases grow?
Deliverables
- One page or less
- Table design + written responses
- Clear section labels
Requirements: enough to met assignment requirements
-
DATA ANLTICS
Ola Cholkan is a recent Seneca College graduate with a diploma in Business Administration, specializing in Entrepreneurship and Small Business. During her studies at Seneca, she participated in the program – a resource that is dedicated to developing the entrepreneurial mindset by providing knowledge, mentorship, sessions, workspace, access to like-minded peer community, and experiential opportunities. Here she developed an idea to start a small business related to her love of pets, and especially to dogs. According to The Canadian Animal Health Institute ( ), the number of pet dogs owned in Canada as of 2018 was 8.2 million, up from 7.6 million in 2016. Further says that a dog owner in Canada can expect to pay about $1,000 a year to care for one dog of which $400 is spent on food. A 2018 survey indicated that 43% of respondents are willing to pay more for healthy pet food. According to , 1-2% of all dogs have cutaneous adverse food reactions, or food allergies that manifest in skin conditions. With all of this research in hand, Ola decided she would bake homemade healthy dog treats for dogs with allergies, i.e., without meat, dairy products, chicken or wheat, and sell them to existing retail pet stores throughout Ontario such as Pet Valu and PetsMart. Since Ola lives in a small apartment, she needs to rent a larger space with a commercial stove and additional staff to help bake the treats and ship them. In the future she would like to add e-commerce capability to her web site and sell directly to customers online.
Ola uses the following recipe to bake her allergy-free dog treats. Each recipe makes 50 treats. There are 10 treats in each package.
- 1 1/2 cup coconut flour
- 1/2 cup unsweetened peanut butter
- 4 organic eggs
- 1/2 cup coconut oil
- 1 cup + 2 tbsp pumpkin puree
The costs associated with baking these treats are outlined in the Excel case file.
When finished reading the case background, select True and move to the next question.
True
False
Requirements: 12
-
data anltics
Case 4- worth 4% of your final grade Format: File Upload. Task instructions are included in the attached Excel file located in question 3.
Requirements: 12
-
data natltics
-
Ola Cholkan is a recent Seneca College graduate with a diploma in Business Administration, specializing in Entrepreneurship and Small Business. During her studies at Seneca, she participated in the program – a resource that is dedicated to developing the entrepreneurial mindset by providing knowledge, mentorship, sessions, workspace, access to like-minded peer community, and experiential opportunities. Here she developed an idea to start a small business related to her love of pets, and especially to dogs. According to The Canadian Animal Health Institute ( ), the number of pet dogs owned in Canada as of 2018 was 8.2 million, up from 7.6 million in 2016. Further says that a dog owner in Canada can expect to pay about $1,000 a year to care for one dog of which $400 is spent on food. A 2018 survey indicated that 43% of respondents are willing to pay more for healthy pet food. According to , 1-2% of all dogs have cutaneous adverse food reactions, or food allergies that manifest in skin conditions. With all of this research in hand, Ola decided she would bake homemade healthy dog treats for dogs with allergies, i.e., without meat, dairy products, chicken or wheat, and sell them to existing retail pet stores throughout Ontario such as Pet Valu and PetsMart. Since Ola lives in a small apartment, she needs to rent a larger space with a commercial stove and additional staff to help bake the treats and ship them. In the future she would like to add e-commerce capability to her web site and sell directly to customers online.Ola uses the following recipe to bake her allergy-free dog treats. Each recipe makes 50 treats. There are 10 treats in each package.
- 1 1/2 cup coconut flour
- 1/2 cup unsweetened peanut butter
- 4 organic eggs
- 1/2 cup coconut oil
- 1 cup + 2 tbsp pumpkin puree
The costs associated with baking these treats are outlined in the Excel case file.When finished reading the case background, select True and move to the next question.
True
False
Requirements: 12
-
-
Developing SQL Statements to Query Existing Data in a Single…
Generate SQL statements to address the problems below using the COVID19_DB database. Each problem must be addressed by a single SQL statement. Use the following database design diagram and data dictionary document as a guide in forming your statements:
You must incorporate confirmatory work screenshots into a Microsoft Word assignment document (or equivalent). The following image illustrates an example problem screenshot showing both the SQL statement and confirmatory execution results:

Problem 1: Display the list of COVID-19 vaccines.
Expected Output:

Problem 2: Display the list of COVID-19 vaccines in alphabetical order by vaccine name.
Expected Output:

Problem 3: Display the COVID-19 vaccines that are suitable for children (minimum age < 18 years).
Expected Output:

Problem 4: Which states/jurisdictions have a population between 10,000,000 and 20,000,000? Show both the state/jurisdiction names and populations in alphabetical order by state/jurisdiction.
Expected Output:

Problem 5: Provide a list of the states/jurisdictions with names starting with the letter M. The output needs to show the state/jurisdiction name, capital, and population in alphabetical order by state/jurisdiction name.
Expected Output:

Problem 6: List the size/area for the following states: Pennsylvania, Iowa, Rhode Island, Maine, and Alabama. Show the state/jurisdiction names and size/area values in descending size/area order.
Expected Output:

Problem 7: Show the COVID-19 vaccine distribution dates for dose allocations that exceeded 600,000 for any of the vaccines. The output needs to show both the vaccine distribution dates and dose allocations. The results must be presented in chronological order (i.e., oldest to most recent).
Expected Output:

Problem 8: List the first and second COVID-19 vaccine dose series volumes for children. Show both the dose series and volume in the output. (Hint: Permissible attribute values for BIT data types are ‘TRUE’ and ‘FALSE’.)
Expected Output:

Problem 9: List the dates the number of reported COVID-19 cases exceeded 75,000 for any state/jurisdiction. Show the calendar date and number of reported COVID-19 cases in chronological order (i.e., oldest to most recent).
Expected Output:

Problem 10: List the COVID-19 vaccine ingredients that are in both the child and adult formulations. Show the ingredients in alphabetical order. (Hint: Permissible attribute values for BIT data types are ‘TRUE’ and ‘FALSE’.)
Expected Output:

Requirements: screen shots of problems
-
apa saja yang di perlukan proses pengolahan agar data dapat…
1. Pengolahan Data Dasar
Fungsi-fungsi yang sering digunakan dalam pengolahan data dasar sebagai berikut:
a. Sort (Mengurutkan)
Digunakan untuk menyusun data berdasarkan urutan tertentu, seperti dari terkecil ke terbesar (ascending) atau sebaliknya.
b. Filter (Menyaring)
Memungkinkan pengguna menampilkan data sesuai kriteria tertentu, misalnya hanya menampilkan nilai di atas 75.
c. Find and Replace
Berguna untuk mencari data tertentu dan menggantinya secara otomatis.
d. Text to Columns
Digunakan untuk memisahkan data dalam satu sel menjadi beberapa kolom, misalnya memisahkan nama depan dan nama belakang.
e. AutoSum / SUM
Menghitung total nilai dari sejumlah data numerik.
f. AVERAGE, MAX, MIN
Masing-masing digunakan untuk menghitung rata-rata, nilai tertinggi, dan nilai terendah dalam sekumpulan data.
g. COUNT dan COUNTA
Menghitung jumlah data, baik yang berisi angka saja (COUNT) maupun semua jenis isi sel (COUNTA).
2. Pengolahan Data Lanjutan
Fungsi-fungsi yang sering digunakan dalam pengolahan data lanjutan mencakup analisis, transformasi, dan visualisasi data. Berikut penjelasannya:
a. Pivot Table
Digunakan untuk menganalisis, meringkas, dan memutar data besar menjadi laporan interaktif berdasarkan kategori tertentu.
b. VLOOKUP, HLOOKUP, XLOOKUP
Digunakan untuk mencari data dalam tabel secara vertikal (VLOOKUP) atau horizontal (HLOOKUP).
XLOOKUP merupakan versi yang lebih fleksibel.
c. IF, IFERROR, dan Fungsi Logika Lainnya
Berguna untuk membuat keputusan bersyarat dalam pengolahan data, seperti memberikan kategori Lulus atau Tidak Lulus.
d. INDEX dan MATCH
Kombinasi fungsi untuk pencarian data yang lebih fleksibel dibandingkan VLOOKUP.
e. Data Analysis Toolpak (di Ms. Excel)
Menyediakan fitur analisis statistik seperti regresi, korelasi, histogram, ANOVA, dan sebagainya.
f. Fungsi Statistik Lanjutan
Seperti STDEV, CORREL, LINEST, untuk menganalisis data secara matematis.
g. Fungsi Text dan Date Lanjutan
Contohnya TEXTJOIN, NETWORKDAYS, DATEDIF untuk manipulasi data teks dan waktu.
h. Visualisasi Data
Menggunakan grafik dinamis seperti charts, sparklines, atau bahkan dashboard interaktif.
Kesimpulan
Pengolahan data dalam aplikasi seperti Microsoft Excel terbagi menjadi pengolahan data dasar dan lanjutan. Pengolahan data dasar berfokus pada pengurutan, penyaringan, dan perhitungan sederhana, sedangkan pengolahan data lanjutan digunakan untuk analisis yang lebih kompleks, pencarian data yang fleksibel, serta penyajian data dalam bentuk visual. Dengan menguasai kedua jenis pengolahan data tersebut, pengguna dapat mengelola dan menganalisis data secara lebih efektif, efisien, dan akurat.
Requirements: