Progress Check
Use this activity to assess whether you and your peers can:
- Use histograms to compare shape, center, and spread in the distribution of a quantitative variable for two groups of individuals.
Directions
Use the drop-down menu to learn about the three steps needed to complete this assignment.
Three steps to complete the assignment
Step 1: Review the Rubric
- Before you submit your work, review the rubric at the bottom of this assignment.
- Use the rubric as a checklist to determine whether you are ready to submit your work.
Step 2: First Draft
- Commit a good-faith effort to address each item in the Prompt section below.
- Please be sure to number your responses and include “white space” between problem numbers. This improves the readability and flow of your work. I cannot give feedback and grade jumbled work.
- Use either of the following options to submit your work.
OPTION 1: You can submit a text-entry assignment (i.e. typing your answers in Canvas). To learn how to submit a text-entry assignment, use these (opens in a new tab).
OPTION 2: You can upload your paper-and-pencil work (or the digital equivalent). To learn how to upload your paper-and-pencil work, use these (opens in a new tab). WARNING – some file types may not be visible on my end. So to learn which files you can upload, be sure to use the directions link I provided for this option. - Not ready to submit a good-faith effort yet? Avoid frustration – use the link to the Questions, Answers, & Tips discussion board (at the bottom of this page) to post questions about this assignment (or visit the discussion board to answer your classmates’ questions). You can also contact me directly (see the homepage for my contact information).
Step 3: Optional Final Draft
- After you submit your good-faith attempt to fully respond to the questions in the Prompt section below, advance to the ANSWER(S) page.
- You can use the ANSWER(S) page to correct your work and resubmit this assignment any time before I begin grading the problems. However, to earn full credit, you are not required to submit a final draft for this assignment. But if you do submit a final draft, I will only grade it if you submitted a good-faith effort on your first draft.
- Warning – I will only grade your most recent submission. So if you choose to submit a final draft, please do not leave anything out, and please do not direct me to read an earlier submission. To maximize your score, your most recent submission (at the time I begin grading) must be complete.
Context
Students researching backpack weights gathered data from 45 elementary school children in the 3rd and 5th grades. The variable is percent of body weight carried in the school backpack. So a child who weighs 60 pounds and carries 9 pounds has a variable value of 15% (9 60 = 0.15 = 15%). The American Chiropractic Association (ACA) recommends that children carry no more than 10% of their body weight.
Prompt
When we analyze backpack weight as a percentage of body weight, how do 3rd and 5th graders compare? Are children in this study following the ACA recommendation?
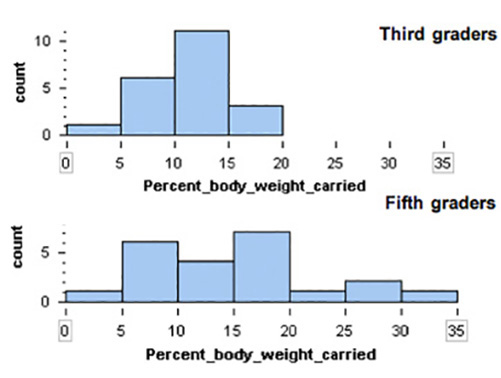
| % of body weight carried in backpack | Third graders |
Fifth graders |
|---|---|---|
| 0-5% | 1 | 1 |
| 5-10% | 6 | 6 |
| 10-15% | 11 | 4 |
| 15-20% | 3 | 7 |
| 20-25% | 0 | 1 |
| 25-30% | 0 | 2 |
| 30-35% | 0 | 1 |
| Totals | 21 | 22 |
Note: Left-hand end-points are included in each bin. So the 2nd bin contains students carrying 5% of their body weight.
Module 7 Discussion Board
Use the Module 7 (opens in a new tab) to ask questions or provide feedback about the problems in any Module 7 activity – including this peer-reviewed assignment.
Review Feedback
- Instructor feedback is only available after an assignment is graded.
- Use these (opens in a new tab) to learn how to review feedback.
Click the “Next” or > button to continue.
Content by Cuyamaca College math faculty and licensed under the .
Rubric
Formative Assessments
| Criteria | Ratings | Pts |
|---|---|---|
|
This criterion is linked to a Learning OutcomeAnswering the Prompt |
|
10 pts |
Total Points: 10
Requirements: 8 h
