In this assignment, you will create a dataset using Microsoft Excel for purposes of analysis later in the course. Your sample dataset will represent two student groups, A and B. Step 1 Open Microsoft Excel to a blank workbook. Double-click on the tab at the bottom of the worksheet and relabel it RES6003, Student Data, or some other relevant title. Step 2 Label Column A of the Excel spreadsheet Student Group by entering that text in Cell A1. Because these groups are categories, they are considered nominal data. Label Column B Remedial Hours in Cell B1. This column will contain interval data, which is the number of hours of remediation the student received between 0 and 20. Label Column C Project Grade in Cell C1. This column will contain ratio data representing the students grade on a major project in the class. The data are ratio because they are expressed in terms of percentage points, which is the number of points scored out of 100. Label Column D Final Grade in Cell D1. This column will contain the final grade the student earned in the class. This is also classified as ratio data because it is a percentage score. Step 3 Column A can have one of two values: A or B. Next, for purposes of this example, populate the first 25 rows with A and the next 25 rows B. Note that the column headings are on Row 1, so you will start on Row 2. Therefore, the B group will start on Row 27. Step 4 In Cell B2, enter the following formula: =RAND()*20. This formula generates a random number between 0 and 20. Round up the random value since we cant have a partial click. Use the Decrease Decimal button on the Excel toolbar in the Number ribbon to round the values to a whole number there should be no decimals. Populate the rest of the rows in Column B by grabbing the corner of the cell and dragging it all the way down the spreadsheet to Row 51. The cells in Column B should now be populated random values between 0 and 20. In Cell C2, enter the following formula: =55+RAND()*45. This formula will generate a random number between 55% and 100%. Now, grab the bottom right corner of the cell again and drag it all the way down to Row 51 of Column C. The Project Grade column should now be populated with values between 55 and 100. Repeat the procedure for the final grade in Column D, but this time, account for the project grade by assuming the student cant score a lower final grade than what they scored on their project. Therefore, enter the following formula into cell D2: =C2+(RAND()*(100-C2)). This will ensure that the final grade ends up somewhere between what they scored on their project and 100. Drag the formula down the column again to Row 51 of Column D. The Final Grade column should now be populated with random scores between the project grade and 100. Dont forget to decrease the decimal for Column C and Column D, leaving at least two decimal places. This will allow a bit more accuracy when you conduct your statistical tests. Step 5 Click on Cell B52 and enter the following formula: = AVERAGE(B2:B51). This will calculate the mean score, or average, for the Hours of Remediation column. Note that this will calculate the average for both groups. After entering the first formula, you can grab the bottom right corner of the cell again and drag the formula to the right, through cells C52 and D52. This should calculate the average scores for the project and the final grade. In a blank area of the worksheet, calculate the averages of each column for each individual group; to do this, only include the rows representing the groups you want. For instance, calculate the average Remedial Hours for each group by using the following formulas instead: Put this (Group As average) in one cell: =AVERAGE(B2:B26). Put this (Group Bs average) in another cell: =AVERAGE(B27:B51). Create appropriate labels for the data in this part of the spreadsheet. Step 6 After generating the random numbers, select all the cells, copy them to the clipboard, and from the paste menu (clipboard icon) choose Paste Values. This ensures the random numbers are not regenerated every time something changes on the spreadsheet. Copy all of the cells and paste the values into a new worksheet in the same workbook, or overwrite the formulas by pasting the values directly on top of them. Step 7 Open Microsoft Excel and install the Data Analysis ToolPak: In Microsoft Excel, click on File > Options > Add Ins. Click Go next to the dropdown labeled Excel Add-ins. Check Analysis ToolPak to enable the Microsoft Data Analysis ToolPak for Microsoft Excel. Confirm that the Data Analysis ToolPak is installed by going to the Data tab on the toolbar ribbon and ensuring the Data Analysis icon appears on the far right.
Category: Statistics
-
Hi pleas I need help for my homework
Progress Check
Use this activity to assess whether you and your peers can:
- Compare distributions to determine whether the primary goal of random assignment is achieved.
Directions
Use the drop-down menu to learn about the three steps needed to complete this assignment.
Three steps to complete the assignment
Step 1: Review the Rubric
- Before you submit your work, review the rubric at the bottom of this assignment.
- Use the rubric as a checklist to determine whether you are ready to submit your work.
Step 2: First Draft
- Commit a good-faith effort to address each item in the Prompt section below.
- Please be sure to number your responses and include “white space” between problem numbers. This improves the readability and flow of your work. I cannot give feedback and grade jumbled work.
- Use either of the following options to submit your work.
OPTION 1: You can submit a text-entry assignment (i.e. typing your answers in Canvas). To learn how to submit a text-entry assignment, use these (opens in a new tab).
OPTION 2: You can upload your paper-and-pencil work (or the digital equivalent). To learn how to upload your paper-and-pencil work, use these (opens in a new tab). WARNING – some file types may not be visible on my end. So to learn which files you can upload, be sure to use the directions link I provided for this option. - Not ready to submit a good-faith effort yet? Avoid frustration – use the link to the Questions, Answers, & Tips discussion board (at the bottom of this page) to post questions about this assignment (or visit the discussion board to answer your classmates’ questions). You can also contact me directly (see the homepage for my contact information).
Step 3: Optional Final Draft
- After you submit your good-faith attempt to fully respond to the questions in the Prompt section below, advance to the ANSWER(S) page.
- You can use the ANSWER(S) page to correct your work and resubmit this assignment any time before I begin grading the problems. However, to earn full credit, you are not required to submit a final draft for this assignment. But if you do submit a final draft, I will only grade it if you submitted a good-faith effort on your first draft.
- Warning – I will only grade your most recent submission. So if you choose to submit a final draft, please do not leave anything out, and please do not direct me to read an earlier submission. To maximize your score, your most recent submission (at the time I begin grading) must be complete.
Context
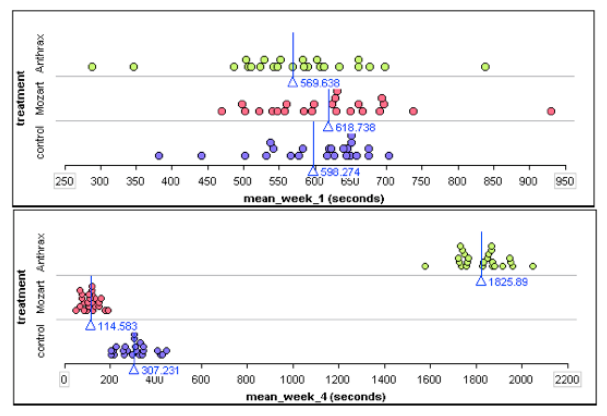
A high school student named David Merrell did an experiment to examine if music affects the ability of mice to run a maze. The explanatory variable was exposure to music. He had three treatment groups: one group listened to heavy metal music by the group Anthrax. A second group listened to Mozart. The third group never heard music. This last group is the control group.
The response variable was the average time (in seconds) to complete three runs. Every week the mice ran the maze three times. Merrell recorded each mouse’s average time for the week.
Direct controls of potential confounding variables:
- Merrell trained all of the mice to run the same maze.
- He gave all mice the same amount of food and light.
- All mice had the same approximate age and weights.
- During the treatment phase, the mice were exposed to the treatment for the same amount of time, e.g. mice heard music at 70 decibels for 10 hours a day for a month.
Results:
By the end of the month, the Anthrax group was much slower at running the maze. The Mozart group was much faster. The dotplots below show average run times for the first and last week of the experiment. Each dot represents one mouse. The X-value is the mouses average run time for the week. (Each mouse ran the maze 3 times each week.) The blue line is the mean run time for each treatment group.
If you are curious, here is a video of Merrell explaining his experiment.
()
Prompt
Merrell claims that he randomly assigned mice to treatment groups. Does the data shown in the dotplots above support his claim? Why or why not?
Module 6 Discussion Board
Use the Module 6 (opens in a new tab) to ask questions or provide feedback about the problems in any Module 6 activity – including this peer-reviewed assignment.
Review Feedback
- Instructor feedback is only available after an assignment is graded.
- Use these (opens in a new tab) to learn how to review feedback.
Click the “Next” or > button to continue.
Content by Cuyamaca College math faculty and licensed under the .
Rubric
Formative Assessments
Formative Assessments
Criteria Ratings Pts This criterion is linked to a Learning OutcomeAnswering the Prompt
10 pts
Total Points: 10
Requirements: 5 h
-
WS 5| Functions and Control Structures
This is the worksheet file:
It is an R- notebook. When you open it, you will be able to download the “Rmd” file.
Save it in a folder, Also save this file
in the same folder.
-
Descriptive Statistics
Complete Research on the 1996 Kentucky Wildcats Basketball Team. The team had a record of 34-2, and were the NCAA Division I National Champions. So, obviously, they were good. Your assignment is to find 5 descriptive stats to build a narrative and tell a story of the team. Write that in MS Word and submit it. Be sure to cite your source(s) in APA format. -
Hi pleas I need help for my home work
Progress Check
Use this activity to assess whether you and your peers can:
- Write a research question that includes the three necessary components of a well-stated research question.
Directions
Use the drop-down menu to learn about the three steps needed to complete this assignment.
Three steps to complete the assignment
Step 1: Review the Rubric
- Before you submit your work, review the rubric at the bottom of this assignment.
- Use the rubric as a checklist to determine whether you are ready to submit your work.
Step 2: First Draft
- Commit a good-faith effort to address each item in the Prompt section below.
- Please be sure to number your responses and include “white space” between problem numbers. This improves the readability and flow of your work. I cannot give feedback and grade jumbled work.
- Use either of the following options to submit your work.
OPTION 1: You can submit a text-entry assignment (i.e. typing your answers in Canvas). To learn how to submit a text-entry assignment, use these (opens in a new tab).
OPTION 2: You can upload your paper-and-pencil work (or the digital equivalent). To learn how to upload your paper-and-pencil work, use these (opens in a new tab). WARNING – some file types may not be visible on my end. So to learn which files you can upload, be sure to use the directions link I provided for this option. - Not ready to submit a good-faith effort yet? Avoid frustration – use the link to the Questions, Answers, & Tips discussion board (at the bottom of this page) to post questions about this assignment (or visit the discussion board to answer your classmates’ questions). You can also contact me directly (see the homepage for my contact information).
Step 3: Optional Final Draft
- After you submit your good-faith attempt to fully respond to the questions in the Prompt section below, advance to the ANSWER(S) page.
- You can use the ANSWER(S) page to correct your work and resubmit this assignment any time before I begin grading the problems. However, to earn full credit, you are not required to submit a final draft for this assignment. But if you do submit a final draft, I will only grade it if you submitted a good-faith effort on your first draft.
- Warning – I will only grade your most recent submission. So if you choose to submit a final draft, please do not leave anything out, and please do not direct me to read an earlier submission. To maximize your score, your most recent submission (at the time I begin grading) must be complete.
Prompt
Hint – the three components of a well-stated research question are stated on the previous page.
Question 1
Give an example of a well-stated research question that involves estimating a characteristic of the population of part-time students at your college.
Question 2
Improve the following research question so that it is a well-stated research question. Research Question: Do students work a lot of hours?
Module 4 Discussion Board
Use the Module 4 (opens in a new tab) to ask questions or provide feedback about the problems in any Module 4 activity – including this peer-reviewed assignment.
Review Feedback
- Instructor feedback is only available after an assignment is graded.
- Use these (opens in a new tab) to learn how to review feedback.
Click the “Next” or > button to continue.
Content by Cuyamaca College math faculty and licensed under the .
Rubric
Formative Assessments
Formative Assessments
Criteria Ratings Pts This criterion is linked to a Learning OutcomeAnswering the Prompt
10 pts
Total Points: 10
Requirements: 10 h
-
Truancy
Please refer to the uploaded file(s) for the assignment as well as the instructions and make certain to adhere to the instructions as Clearly stated. Thanks Module 2 Discussion Read pages 17-18 in the tutorial quick guide text found below. Provide an example of 2 null and 2 alternative hypotheses. Feel free to create the null and alternative hypotheses based on your dissertation topic if you wish. ******My dissertation topic is on Truancy*****Attached Files (PDF/DOCX): Module 2 Discussion Nonparametric.pdf, tutorsquickguidetostatistics.pdf
Note: Content extraction from these files is restricted, please review them manually.
-
Statistics 10
Attached Files (PDF/DOCX): statistics 10.pdf, Statistice PDF Book to read.pdf
Note: Content extraction from these files is restricted, please review them manually.
-
MAT 240 Project Two
Competency
In this project, you will demonstrate your mastery of the following competency:
- Apply statistical techniques to address research problems
- Perform hypothesis testing to address an authentic problem
Overview
In this project, you will apply inference methods for means to test your hypotheses about the housing sales market for a region of the United States. You will use appropriate sampling and statistical methods.
Scenario
You have been hired by your regional real estate company to determine if your regions housing prices and housing square footage are significantly different from those of the national market. The regional sales director has three questions that they want to see addressed in the report:
- Are housing prices in your regional market lower than the national market average?
- Is the square footage for homes in your region different than the average square footage for homes in the national market?
- For your region, what is the range of values for the 95% confidence interval of square footage for homes in your market?
You are given a real estate data set that has houses listed for every county in the United States. In addition, you have been given national statistics and graphs that show the national averages for housing prices and square footage. Your job is to analyze the data, complete the statistical analyses, and provide a report to the regional sales director. You will do so by completing the Project Two Template located in the What to Submit area below.
Directions
Introduction
- Region: Start by picking one region from the following list of regions:
- West South Central, West North Central, East South Central, East North Central, Mid Atlantic
- Purpose: What is the purpose of your analysis?
- Sample: Define your sample. Take a random sample of 500 house sales for your region.
- Describe what is included in your sample (i.e., states, region, years or months).
- Questions and type of test: For your selected sample, define two hypothesis questions (see the Scenario above) and the appropriate type of test for each. Address the following for each hypothesis:
- Describe the population parameter for the variable you are analyzing.
- Describe your hypothesis in your own words.
- Identify the hypothesis test you will use (1-Tail or 2-Tail).
- Level of confidence: Discuss how you will use estimation and confidence intervals to help you solve the problem.
1-Tail Test
- Hypothesis: Define your hypothesis.
- Define the population parameter.
- Write null (Ho) and alternative (Ha) hypotheses. Note: For means, define a hypothesis that is less than the population parameter.
- Specify your significance level.
- Data analysis: Summarize your sample data using appropriate graphical displays and summary statistics and confirm assumptions have not been violated to complete this hypothesis test.
- Provide at least one histogram of your sample data.
- In a table, provide summary statistics including sample size, mean, median, and standard deviation. Note: For quartiles 1 and 3, use the quartile function in Excel:
- =QUARTILE([data range], [quartile number])
- Summarize your sample data, describing the center, spread, and shape in comparison to the national information (under Supporting Materials, see the National Summary Statistics and Graphs House Listing Price by Region PDF). Note: For shape, think about the distribution: skewed or symmetric.
- Check the conditions.
- Determine if the normal condition has been met.
- Determine if there are any other conditions that you should check and whether they have been met. Note: Think about the central limit theorem and sampling methods.
- Hypothesis test calculations: Complete hypothesis test calculations.
- Calculate the hypothesis statistics.
- Determine the appropriate test statistic (t). Note: This calculation is (mean target)/standard error. In this case, the mean is your regional mean, and the target is the national mean.
- Calculate the probability (p value). Note: This calculation is done with the T.DIST function in Excel:
- =T.DIST([test statistic], [degree of freedom], True) The degree of freedom is calculated by subtracting 1 from your sample size.
- Interpretation: Interpret your hypothesis test results using the p value method to reject or not reject the null hypothesis.
- Relate the p value and significance level.
- Make the correct decision (reject or fail to reject).
- Provide a conclusion in the context of your hypothesis.
2-Tail Test
- Hypotheses: Define your hypothesis.
- Define the population parameter.
- Write null and alternative hypotheses. Note: For means, define a hypothesis that is not equal to the population parameter.
- State your significance level.
- Data analysis: Summarize your sample data using appropriate graphical displays and summary statistics and confirm assumptions have not been violated to complete this hypothesis test.
- Provide at least one histogram of your sample data.
- In a table, provide summary statistics including sample size, mean, median, and standard deviation. Note: For quartiles 1 and 3, use the quartile function in Excel:
- =QUARTILE([data range], [quartile number])
- Summarize your sample data, describing the center, spread, and shape in comparison to the national information. Note: For shape, think about the distribution: skewed or symmetric.
- Check the assumptions.
- Determine if the normal condition has been met.
- Determine if there are any other conditions that should be checked on and whether they have been met. Note: Think about the central limit theorem and sampling methods.
- Hypothesis test calculations: Complete hypothesis test calculations.
- Calculate the hypothesis statistics.
- Determine the appropriate test statistic (t). Note: This calculation is (mean target)/standard error. In this case, the mean is your regional mean, and the target is the national mean.]
- Determine the probability (p value). Note: This calculation is done with the TDIST.2T function in Excel:
- =T.DIST.2T([test statistic], [degree of freedom]) The degree of freedom is calculated by subtracting 1 from your sample size.
- Interpretation: Interpret your hypothesis test results using the p value method to reject or not reject the null hypothesis.
- Compare the p value and significance level.
- Make the correct decision (reject or fail to reject).
- Provide a conclusion in the context of your hypothesis.
- Comparison of the test results: Revisit Question 3 from the Scenario section: For your region, what is the range of values for the 95% confidence interval of square footage for homes?
- Calculate and report the 95% confidence interval. Show or describe your method of calculation.
Final Conclusions
- Summarize your findings: In one paragraph, summarize your findings in clear and concise plain language.
- Discuss: Discuss whether you were surprised by the findings. Why or why not?
You can use the following tutorial that is specifically about this assignment:
What to Submit
To complete this project, you must submit the following:
: Use this template to structure your report and submit the finished version as a Word document. Also submit your Excel file showing all steps and calculations used in the report.
Supporting Materials
The following resources may help support your work on the project:
Data Set:
Use this data for input in your project report.
Document:
Use this data for input in your project report.
Use these tutorials for support with the Excel functions you will use in the project:
- Tutorial:
- Tutorial:
- Tutorial:
- Tutorial:
Attached Files (PDF/DOCX): National Summary Statistics and Graphs House Listing Price by Region Project 2.pdf, MAT 240 Project Two Template.docx
Note: Content extraction from these files is restricted, please review them manually.
-
Week 5 Discussion Question 1 & 2 and Week 5 Homework
Below are 2 discussion post and a homework assignment
discussion post needs 150 words minimum for each and are to be answered separately with references if needed.
Week 5 Discussion Question 1
You have the task of identifying a question and creating 2 to 3 variables to complete a mini study. In this mini study, you will have a question, and you will collect the data for these 2 to 3 variables that answer the question you identified.
1. The adults who are invested in you should have an official role: professor, coach, counselor, pastor, parents or similar position of support. If you have difficulty reaching 6 adults to collect data from, you can use accountability partners.
2. The goal of this mini study is to identify how these invested adults use data about you to determine how they feel about the variable you selected.
3. Also determine how they measure movement in the data.
3. You will need to collect this data in a table or an Excel spreadsheet, then upload it directly into the discussion post so everyone can see it. There is no exception to this requirement.
4. You will need at least 6 participants.
5. In addition, you will identify whether the invested adults’ comments can be grouped into one of four psychological mindsets. This means: are they identifying behaviors in you that reflect your God-given ability, your belief in yourself, your attitude about life, and the things you need to do, or your motivation to do them?
6. Youre using this information to provide a psychological hypothesis about the framing of your participants for this mini study. You do not need to analyze this data in this upload, but all required information must be included for full credit, with 2 replies to classmates. Half credit will be given to student that do not have interaction with classmates.
Week 5 Discussion Question 2
Analyze the data uploaded in Discussion 1 from this week. You need to provide:
1. A null and alternative hypothesis using the proper notation.
2. You need to determine: a. central tendency, frequency, relative frequency, variance, standard deviation, of your data in a table that allows others to both see and understand your data. You will need at least 1 table per variable.
3. You will need to graph this analysis using both descriptive and inferential statistics. Spend some time selecting the most appropriate approach.
4. You will provide a narrative of this analysis results that follow the MEAL plan: M-main idea, E-evidence, A-analysis of the meaning of the results to your and your future career and life. L-link to the way you can use this information in your Christian worldview in support of data analysis results.
Week 5 Homework
book info: Textbook(s):
Title: Basic Statistics for Behavioral Sciences, 7th Edition
Author: W. Heiman, Gary W.
Publisher: Wadsworth Publishing, Cengage Advantage Books
Edition: 7th (2013)
ISBN: 978-1285054865
- Chapter 9 and Chapter 10 Homework
- Answer the following Review/Application Questions at the end of each chapter as well as the additional question(s) listed:
- Chapter 9
- Part 1 Chapter 9 Application Questions # 14, 16, 18
- Part 2 – Use this online dice roller (
- ) to roll a 6 sided die 20 times and record the numbers. What is the empirical probability of rolling a 4? What is the theoretical probability of rolling a 1?
- Chapter 10
- Part 1 Chapter 10 Application Questions # 14 (references number 13, not 11), 16, 18
- Part 2 Why can no statistical result prove that changing the independent variable causes the dependent variable to change? What one thing does a significant result prove?
-
Probability and Statistics
Written HW #1 Please submit the original document with ONLY the answers appearing on the blanks provided, followed by your work. You are expected to show all work on pages attached following the document, and NOT on the original document.Attached Files (PDF/DOCX): AMS102HW1 (4).pdf
Note: Content extraction from these files is restricted, please review them manually.