Question 1
-
- Which IAT data set are you working with?
- Use StatCrunch and your unique IAT sample to estimate the mean age for the population of IAT participants at the 90% confidence level. Copy the contents of your StatCrunch output window and paste them into your response. (No need to type anything here – just copy and paste the contents of your StatCrunch output window.)
- Are conditions met to estimate the mean age for the population of IAT participants? (Be sure to support your answer as demonstrated throughout Unit 8.)
- State the confidence interval, and then interpret the confidence interval in context.
- What is the margin of error (MOE)?
- Which would be more accurate, the 90% confidence interval you found or an 85% confidence interval? Briefly explain. Which would be more precise? Briefly explain.
Question 2
At the end of 2020, the mean age of the U.S. population was estimated to be 38.5 years old. You are tasked with determining whether the mean age of the population of IAT participants (for your chosen IAT data set) differs from the mean age of the U.S. population.
-
- Let be the mean age of the population of IAT participants for your chosen IAT data set. State the hypotheses (symbolically and in words). Include a clear description of the populations and the variable.
- Use StatCrunch to create a histogram for the age distribution in your unique IAT sample. Download the StatCrunch output window and embed your histogram with your response. Can we safely use the t-test with your IAT sample? Explain.
- Perform the t-test using StatCrunch. Copy the information from the StatCrunch output window and paste it into your response.
- Based on the P-value, state your conclusions in context. Use a 5% level of significance. (NOTE: Since StatCrunch correctly calculates the P-value for either a one-tailed or a two-tailed test, you do not need to change the StatCrunch P-value.)
- Using the context of this scenario, explain the meaning of each of the following items from the StatCrunch output for the hypothesis test.
Std. Err (standard error)
T-stat (T-score)
P-value
Question 3
Below are the variables for Question 3. For all data sets, the categorical variable is the explanatory variable, and the quantitative variable is the response variable.
Race IAT Variables for Question 3 Only
Open for the Race variables
Open for the Weapons variables
Weight IAT Variables for Question 3 Only
Open for the Weight variables
- Choose only one of the categorical variables listed for your IAT data set and note the two groups for your chosen categorical variable.
- Here is the question to be investigated for the two groups in your chosen categorical variable.
Do the population of IAT participants in one group score higher on the IAT test than the population of IAT participants in the other group?
To answer the question we are investigating, respond to each of the following
-
- Use StatCrunch to determine the sample size and sample mean, , for the two groups in your chosen categorical variable (). These directions assume your data set is open in StatCrunch.
- Select Stat Summary Stats Columns
- The Summary Stats window is now open.
- In the Select column(s): section, click on the IAT score variable to move it to the box on the right.
- In the Group by: section, use the drop-down menu to select your chosen categorical variable.
- In the Statistics: section, click on n (the sample size). On a Mac, use command + click to choose the mean. Or, on a PC use CTRL + click to choose mean. As you choose each item, it appears in the white box on the right. In the white box on the right, you should now see n and mean.
- Click Compute!
- Your StatCrunch output window should look similar to this. However, you may be using a different IAT data set. Also, you may have chosen a different categorical variable (from the two options provided in the assignment). Finally, your output window may only include two groups as opposed to the three displayed here (although – as per the assignment instructions for this categorical variable, we are directed to ignore the third group, so we crossed it out).
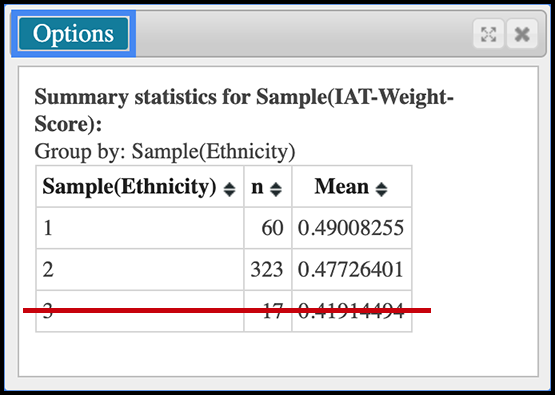
- Copy your StatCrunch output table and paste it into your response. Then relabel the categorical variable groups with the appropriate word(s), i.e., replace the group numbers with the appropriate word(s) to describe the group (see the Categorical Variable section above for your data set).
- Use StatCrunch to determine the sample size and sample mean, , for the two groups in your chosen categorical variable (). These directions assume your data set is open in StatCrunch.
-
-
- Which of the two groups has the smallest sample mean? Which has the largest sample mean?
- Let be the population mean for the group with the largest sample mean. Let be the population mean for the group with the smallest sample mean. State the null and alternative hypotheses (symbolically and in words). Include a clear description of the populations and the variable.
- To test your hypotheses, is it appropriate to use the two-sample T-test? If so, explain why and provide any supporting evidence. If not, start over and choose the other categorical variable listed with your chosen IAT data set.
- WARNING: If it is not appropriate to use the two-sample T-test for either of the categorical variables listed with your IAT data set, something may be wrong. Stop and contact me as soon as possible.
- Proceed only if it is appropriate to use the two-sample T-test.
- Use StatCrunch to carry out the test ().
Written Directions
- Choose: Stat T Stats Two Sample With Data
- Select the data column (twice – the first time for Sample 1 and the second time for Sample 2).
- Under the Sample 1: heading:
- Use the Values in: drop-down menu to select the appropriate quantitative variable.
- Use the Where option to “build” the Sample 1 group. Here you are “building” a category from the explanatory variable. To do this:
- Click on Build.
- Then choose the appropriate categorical variable, and click on it until the categorical variable shows up in the Expression line at the top of the Expression window.
- Your cursor should now be in the Expression line right after the categorical variable. Type the equal sign.
- Use the Values: drop-down menu (bottom-left of the Expression window) to select the group for your first sample. Then click the Add button (to the right of the drop-down menu).
- Click Okay in the bottom right corner of the Expression window.
- For the second sample, we repeat these steps. Under the Sample 2: heading:
- Use the Values in: drop-down menu to select the appropriate quantitative variable. The same quantitative variable you selected for Sample 1.
- Use the Where option to “build” the Sample 2 group. Here you are “building” a category from the explanatory variable. To do this:
- Click on Build.
- Then choose the same categorical variable you chose for Sample 1, and click on it until the categorical variable shows up in the Expression line at the top of the Expression window.
- Your cursor should now be in the Expression line right after the categorical variable. Type the equal sign.
- Use the Values: drop-down menu (bottom-left of the Expression window) to select the group for your second sample. Then click the Add button (to the right of the drop-down menu).
- Click Okay in the bottom right corner of the Expression window.
- Under Perform select the appropriate hypothesis test (based on the alternative hypothesis).
- Press Compute!
- Copy the content in the StatCrunch output window (text and the table) and paste it into the textbox as your response to this item.
- Use a 5% significance level to state a conclusion. Be sure to state your conclusion in context and in terms of what a more positive score on the IAT means for your data set. (Hint: in the variables section above, click on the variable descriptions link for your data set. The variable descriptions page opens in a new window. Review the Interpreting the IAT section at the top of that page.)
-
Get this or a similar paper done in as fast as 4 hours, 24/7.
NB: We do not sell prewritten papers. All essays are written from scratch according to specific needs and instructions
✔Secure Service ✔ Plagiarism Free ✔On-time Delivery
Leave a Reply
You must be logged in to post a comment.