Instructions
Work through this quiz to prepare for the Module 11 – Treating Depression Lab Part 1. This activity is included in the Labs and Other Activities portion of your grade. You have an unlimited number of attempts. To prepare for the lab, you must review each attempt and use the feedback to retake the quiz until you earn 100%. In other words, you cannot move on until you earn 100% on this quiz. But don’t let your good productive struggle devolve into frustration. If you carefully reviewed the feedback after two attempts, and you still haven’t earned 100%, use the discussion board below to ask for help. Give your peers or me some time to respond. Then return to the discussion board, review the responses, and try again. Or you can also contact me directly. My contact information is on the homepage of our course in Canvas.
Prepare for the Online Lab
Use this activity to:
- Obtain information from a spreadsheet.
- Identify the explanatory variable and the response variable.
- Select an appropriate visual display to summarize the data.
- Select the appropriate numerical summaries to summarize the data.
Below is the information you will find in the lab on the next page (after you finish this preparation quiz).
Context
Clinical depression is a recurrent illness requiring treatment and often hospitalization. Nearly 50% of people who have an episode of major depression will have a recurrence within 2-3 years. Being able to prevent the recurrence of depression in people who are at risk for the disease would go a long way to alleviate the pain and suffering of patients.
During the 1980’s the federal government, through the National Institutes of Health (NIH), sponsored a large clinical trial to evaluate two drugs for depression. There were 3 treatment groups. Patients received either Imipramine (Imip), Lithium (Li), or a Placebo (Pl). Researchers randomly assigned patients to one of the 3 treatment groups and followed them for 2-4 years to track any recurrences of depression.
(Prien et al., Archives of General Psychiatry, 1984).
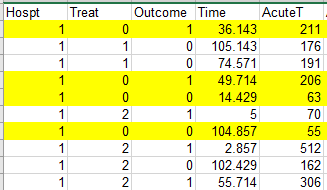
Variables
- Hospt: Which hospital the patient was from: Labeled 1, 2, 3, 5 or 6
- Treat: 0=Lithium; 1=Imipramine; 2=Placebo
- Outcome: 0=Success 1=Failure (no recurrence of depression)
- Time: Number of weeks until a recurrence (if outcome=1) or until study ended (if outcome=0)
- AcuteT: How long the patient was depressed before the start of the current study, measured in days
- Age: Age in years
- Gender: 1=Female 2=Male
Data
- Open the depression data set in the Stats at Cuyamaca College group on StatCrunch ( – opens in a new tab).
Prompt
In this quiz, you’ll explore the depression datafile in StatCrunch and familiarize yourself with the first research question related to this study. In the next activity you’ll use StatCrunch to investigate the first research question.
Module 11 Discussion Board
Use the Module 11 (opens in a new tab) to ask questions or provide feedback about the problems in any Module 11 activity – including this quiz. Question 10 / 1.3 pts
Examine the spreadsheet of data in StatCrunch. Out of the first ten individuals in the datafile, how many had a recurrence of depression during the study?
Incorrect. You want the number of patients who had a recurrence of depression (Outcome = 1) out of the first ten patients.
IncorrectQuestion 20 / 1.4 pts
Examine the spreadsheet of data in StatCrunch. Out of the first ten individuals in the datafile who were assigned to the Lithium treatment group, how many had a recurrence of depression during the study?
Incorrect. Look at the first ten patients who were in the Lithium treatment group (Treat = 0). Then count the number out of those ten Lithium patients who had a recurrence of depression (Outcome = 1) during the study.
Did you think the answer was 2? Be careful. This question is not about just the first 10 people in the spreadsheet. It’s about the first 10 people who had the lithium treatment. So you may need to keep looking past the first 10 people in the spreadsheet.
It may be helpful to highlight the Lithium patients (Treat = 0) until you have found the first 10 Lithium patients.
IncorrectQuestion 30 / 1.3 pts
Examine the spreadsheet of data in StatCrunch. How many days was the first male in the datafile depressed before the start of the study?
Incorrect. Find the first male in the datafile (Gender = 2). Then look at his AcuteT, the number of days he was depressed before the start of the study.
PartialQuestion 43 / 6 pts
Here is the first research question related to the study:
Which of the drugs (if either) was more successful in preventing the recurrence of depression relative to the placebo?
The explanatory variable is Treat , and it is a categorical variable.
The response variable is Outcome , and it is a quantitative variable.
To answer the research question, you will analyze the data. Which visual graph or table is appropriate for your analysis? Side-by-side boxplots
Which of the following is an appropriate numerical summary to include in your analysis? Descriptive statistics (mean, median, etc.)
Answer 1:
Correct. Treat represents the treatment groups (Lithium, Imipramine, and placebo). To answer the question, we must compare the different drugs (treatments). So Treat is the explanatory variable.
Answer 2:
categorical
Correct. The values of this explanatory variable are numeric, but the numbers define categories (0=Lithium; 1=Imipramine; 2=Placebo), so it is a categorical variable.
Answer 3:
Correct. Outcome represents whether the drug/placebo was successful (Outcome=0) in preventing the recurrence of depression or not (Outcome=1)
Answer 4:
Incorrect. The response variable indicates whether the treatment was successful or not, so it is a categorical variable with the categories success and failure.
Answer 5:
Side-by-side boxplots
Incorrect. We use side-by-side boxplots to compare a single quantitative variable across multiple groups of a categorical variable. We are not analyzing a quantitative variable.
Answer 6:
Descriptive statistics (mean, median, etc.)
Incorrect. We use descriptive statistics such as mean, median, standard deviation, IQR, etc. to describe the distribution of a single quantitative variable across multiple groups of a categorical variable.
Treat and Outcome are two categorical variables.
Get this or a similar paper done in as fast as 4 hours, 24/7.
NB: We do not sell prewritten papers. All essays are written from scratch according to specific needs and instructions
Leave a Reply
You must be logged in to post a comment.