What is the internet. Explain 2 advantages and disadvantages?
Category: Statistics
-
find the meadian to the following data .
A teacher recorded the marks obtained by 10 students in a mathematics test. The marks are given below:
45, 50, 55, 60, 65, 70, 75, 80, 85, 90
-
Hi pleas I need help for my homework
Progress Check
Use this activity to assess whether you and your peers can:
- Use summarized data to conduct a chi-square test of independence and interpret the conclusion in context.
Directions
Use the drop-down menu to learn about the three steps needed to complete this assignment.
Three steps to complete the assignment
Step 1: Review the Rubric
- Before you submit your work, review the rubric at the bottom of this assignment.
- Use the rubric as a checklist to determine whether you are ready to submit your work.
Step 2: First Draft
- Commit a good-faith effort to address each item in the Prompt section below.
- Please be sure to number your responses and include “white space” between problem numbers. This improves the readability and flow of your work. I cannot give feedback and grade jumbled work.
- Use either of the following options to submit your work.
OPTION 1: You can submit a text-entry assignment (i.e. typing your answers in Canvas). To learn how to submit a text-entry assignment, use these (opens in a new tab).
OPTION 2: You can upload your paper-and-pencil work (or the digital equivalent). To learn how to upload your paper-and-pencil work, use these (opens in a new tab). WARNING – some file types may not be visible on my end. So to learn which files you can upload, be sure to use the directions link I provided for this option. - Not ready to submit a good-faith effort yet? Avoid frustration – use the link to the Questions, Answers, & Tips discussion board (at the bottom of this page) to post questions about this assignment (or visit the discussion board to answer your classmates’ questions). You can also contact me directly (see the homepage for my contact information).
Step 3: Optional Final Draft
- After you submit your good-faith attempt to fully respond to the questions in the Prompt section below, advance to the ANSWER(S) page.
- You can use the ANSWER(S) page to correct your work and resubmit this assignment any time before I begin grading the problems. However, to earn full credit, you are not required to submit a final draft for this assignment. But if you do submit a final draft, I will only grade it if you submitted a good-faith effort on your first draft.
- Warning – I will only grade your most recent submission. So if you choose to submit a final draft, please do not leave anything out, and please do not direct me to read an earlier submission. To maximize your score, your most recent submission (at the time I begin grading) must be complete.
Context – A Real Court Case
In the early 1970s, a young man challenged an Oklahoma state law that prohibited the sale of 3.2% beer to males under age 21 but allowed its sale to females in the same age group. The case (Craig v. Boren, 429 U.S. 190, 1976) was ultimately heard by the U.S. Supreme Court. The state of Oklahoma argued that the law improved traffic safety. One of the three main pieces of data presented to the court was the result of a random roadside survey. This survey gathered information on gender and whether or not the driver had been drinking alcohol in the previous 2 hours. A total of 619 drivers under 21 years of age were included in the survey.
Prompt
- A test of independence may be appropriate if we are examining the relationship between two categorical variables in one population. For this situation what is the population? What is the explanatory variable? What is the response variable?
- What are the hypotheses for the Test of Independence? State hypotheses with reference to the context of the scenario.
- The spreadsheet of the data looked like this:
Roadside survey data Driver Gender Alcohol in last
two hours?Driver 1 M Yes Driver 2 F No Driver 3 F Yes .
.
..
.
..
.
.Driver 619 M No We will not use the raw data. Instead, we will use the summarized data shown in the table below.
Roadside survey summary Drank alcohol in last 2 hours? Yes No Totals Male 77 404 481 Female 16 122 138 Totals 93 526 619 Use StatCrunch to find expected counts, the Chi-square test statistic, and the P-value. ()
Copy and paste your StatCrunch table into the textbox. - How many males in the sample are expected to answer yes to questions about alcohol consumption in the last two hours? Show how to calculate this expected count and explain what it means relative to the hypotheses.
- Explain how we know that this data meets the conditions for use of a chi-square distribution.
- State a conclusion at a 5% level of significance. Do you think that the data supports the Oklahoma law that forbids the sale of 3.2% beer to males and permits it to females?
List of StatCrunch Directions
Click here for StatCrunch Directions
Each link will open in a new window. To return to this assignment, either close the new tab or select the tab for this assignment.
- (no screenshots; please use these directions)
- (no attachments; please use these directions)
Optional Discussion Board
Use the Module 25 (opens in a new tab) to ask questions or provide feedback about the problems in any Module 25 activity – including this peer-reviewed assignment.
Review Feedback
- Instructor feedback is only available after an assignment is graded.
- Use these (opens in a new tab) to learn how to review feedback.
Click the “Next” or > button to continue.
Content by Cuyamaca College math faculty and licensed under the .
Rubric
Formative Assessments w/ StatCrunch
Formative Assessments w/ StatCrunch
Criteria Ratings Pts This criterion is linked to a Learning OutcomeAnswering the Prompt
8 pts
This criterion is linked to a Learning OutcomeStatCrunch
2 pts
Total Points: 10
-
Project 8
Question 1
-
- Which IAT data set are you working with?
- Use StatCrunch and your unique IAT sample to estimate the mean age for the population of IAT participants at the 90% confidence level. Copy the contents of your StatCrunch output window and paste them into your response. (No need to type anything here – just copy and paste the contents of your StatCrunch output window.)
- Are conditions met to estimate the mean age for the population of IAT participants? (Be sure to support your answer as demonstrated throughout Unit 8.)
- State the confidence interval, and then interpret the confidence interval in context.
- What is the margin of error (MOE)?
- Which would be more accurate, the 90% confidence interval you found or an 85% confidence interval? Briefly explain. Which would be more precise? Briefly explain.
Question 2
At the end of 2020, the mean age of the U.S. population was estimated to be 38.5 years old. You are tasked with determining whether the mean age of the population of IAT participants (for your chosen IAT data set) differs from the mean age of the U.S. population.
-
- Let be the mean age of the population of IAT participants for your chosen IAT data set. State the hypotheses (symbolically and in words). Include a clear description of the populations and the variable.
- Use StatCrunch to create a histogram for the age distribution in your unique IAT sample. Download the StatCrunch output window and embed your histogram with your response. Can we safely use the t-test with your IAT sample? Explain.
- Perform the t-test using StatCrunch. Copy the information from the StatCrunch output window and paste it into your response.
- Based on the P-value, state your conclusions in context. Use a 5% level of significance. (NOTE: Since StatCrunch correctly calculates the P-value for either a one-tailed or a two-tailed test, you do not need to change the StatCrunch P-value.)
- Using the context of this scenario, explain the meaning of each of the following items from the StatCrunch output for the hypothesis test.
Std. Err (standard error)
T-stat (T-score)
P-value
Question 3
Below are the variables for Question 3. For all data sets, the categorical variable is the explanatory variable, and the quantitative variable is the response variable.
Race IAT Variables for Question 3 Only
Open for the Race variables
Open for the Weapons variables
Weight IAT Variables for Question 3 Only
Open for the Weight variables
- Choose only one of the categorical variables listed for your IAT data set and note the two groups for your chosen categorical variable.
- Here is the question to be investigated for the two groups in your chosen categorical variable.
Do the population of IAT participants in one group score higher on the IAT test than the population of IAT participants in the other group?
To answer the question we are investigating, respond to each of the following
-
- Use StatCrunch to determine the sample size and sample mean, , for the two groups in your chosen categorical variable (). These directions assume your data set is open in StatCrunch.
- Select Stat Summary Stats Columns
- The Summary Stats window is now open.
- In the Select column(s): section, click on the IAT score variable to move it to the box on the right.
- In the Group by: section, use the drop-down menu to select your chosen categorical variable.
- In the Statistics: section, click on n (the sample size). On a Mac, use command + click to choose the mean. Or, on a PC use CTRL + click to choose mean. As you choose each item, it appears in the white box on the right. In the white box on the right, you should now see n and mean.
- Click Compute!
- Your StatCrunch output window should look similar to this. However, you may be using a different IAT data set. Also, you may have chosen a different categorical variable (from the two options provided in the assignment). Finally, your output window may only include two groups as opposed to the three displayed here (although – as per the assignment instructions for this categorical variable, we are directed to ignore the third group, so we crossed it out).
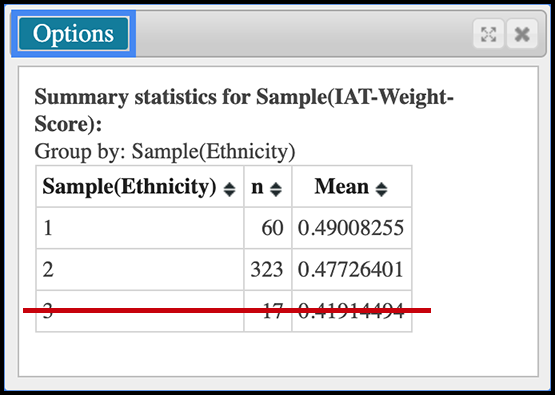
- Copy your StatCrunch output table and paste it into your response. Then relabel the categorical variable groups with the appropriate word(s), i.e., replace the group numbers with the appropriate word(s) to describe the group (see the Categorical Variable section above for your data set).
- Use StatCrunch to determine the sample size and sample mean, , for the two groups in your chosen categorical variable (). These directions assume your data set is open in StatCrunch.
-
-
- Which of the two groups has the smallest sample mean? Which has the largest sample mean?
- Let be the population mean for the group with the largest sample mean. Let be the population mean for the group with the smallest sample mean. State the null and alternative hypotheses (symbolically and in words). Include a clear description of the populations and the variable.
- To test your hypotheses, is it appropriate to use the two-sample T-test? If so, explain why and provide any supporting evidence. If not, start over and choose the other categorical variable listed with your chosen IAT data set.
- WARNING: If it is not appropriate to use the two-sample T-test for either of the categorical variables listed with your IAT data set, something may be wrong. Stop and contact me as soon as possible.
- Proceed only if it is appropriate to use the two-sample T-test.
- Use StatCrunch to carry out the test ().
Written Directions
- Choose: Stat T Stats Two Sample With Data
- Select the data column (twice – the first time for Sample 1 and the second time for Sample 2).
- Under the Sample 1: heading:
- Use the Values in: drop-down menu to select the appropriate quantitative variable.
- Use the Where option to “build” the Sample 1 group. Here you are “building” a category from the explanatory variable. To do this:
- Click on Build.
- Then choose the appropriate categorical variable, and click on it until the categorical variable shows up in the Expression line at the top of the Expression window.
- Your cursor should now be in the Expression line right after the categorical variable. Type the equal sign.
- Use the Values: drop-down menu (bottom-left of the Expression window) to select the group for your first sample. Then click the Add button (to the right of the drop-down menu).
- Click Okay in the bottom right corner of the Expression window.
- For the second sample, we repeat these steps. Under the Sample 2: heading:
- Use the Values in: drop-down menu to select the appropriate quantitative variable. The same quantitative variable you selected for Sample 1.
- Use the Where option to “build” the Sample 2 group. Here you are “building” a category from the explanatory variable. To do this:
- Click on Build.
- Then choose the same categorical variable you chose for Sample 1, and click on it until the categorical variable shows up in the Expression line at the top of the Expression window.
- Your cursor should now be in the Expression line right after the categorical variable. Type the equal sign.
- Use the Values: drop-down menu (bottom-left of the Expression window) to select the group for your second sample. Then click the Add button (to the right of the drop-down menu).
- Click Okay in the bottom right corner of the Expression window.
- Under Perform select the appropriate hypothesis test (based on the alternative hypothesis).
- Press Compute!
- Copy the content in the StatCrunch output window (text and the table) and paste it into the textbox as your response to this item.
- Use a 5% significance level to state a conclusion. Be sure to state your conclusion in context and in terms of what a more positive score on the IAT means for your data set. (Hint: in the variables section above, click on the variable descriptions link for your data set. The variable descriptions page opens in a new window. Review the Interpreting the IAT section at the top of that page.)
-
-
-
Statistics Question
Hello attached is the the following my assignment I need help with. Its actually my exam. Ive attached the exam, my assignment, and also the corrected answers of the assignment on top of the statistical formulas and also the statistical table to look at.
-
Population a mean
- Use StatCrunch to find a one-sample T-interval to estimate a population mean.
- Interpret a confidence interval in context.
- Use a confidence interval to find the margin of error (MOE).
- Identify which of the two confidence intervals is more accurate.
- Identify which of the two confidence intervals is more precise.
Directions
Use the drop-down menu to learn about the three steps needed to complete this assignment.
Three steps to complete the assignment
Step 1: Review the Rubric
- Before you submit your work, review the rubric at the bottom of this assignment.
- Use the rubric as a checklist to determine whether you are ready to submit your work.
Step 2: First Draft
- Commit a good-faith effort to address each item in the Prompt section below.
- Please be sure to number your responses and include “white space” between problem numbers. This improves the readability and flow of your work. I cannot give feedback and grade jumbled work.
- Use either of the following options to submit your work.
OPTION 1: You can submit a text-entry assignment (i.e. typing your answers in Canvas). To learn how to submit a text-entry assignment, use these (opens in a new tab).
OPTION 2: You can upload your paper-and-pencil work (or the digital equivalent). To learn how to upload your paper-and-pencil work, use these (opens in a new tab). WARNING – some file types may not be visible on my end. So to learn which files you can upload, be sure to use the directions link I provided for this option. - Not ready to submit a good-faith effort yet? Avoid frustration – use the link to the Questions, Answers, & Tips discussion board (at the bottom of this page) to post questions about this assignment (or visit the discussion board to answer your classmates’ questions). You can also contact me directly (see the homepage for my contact information).
Step 3: Optional Final Draft
- After you submit your good-faith attempt to fully respond to the questions in the Prompt section below, advance to the ANSWER(S) page.
- You can use the ANSWER(S) page to correct your work and resubmit this assignment any time before I begin grading the problems. However, to earn full credit, you are not required to submit a final draft for this assignment. But if you do submit a final draft, I will only grade it if you submitted a good-faith effort on your first draft.
- Warning – I will only grade your most recent submission. So if you choose to submit a final draft, please do not leave anything out, and please do not direct me to read an earlier submission. To maximize your score, your most recent submission (at the time I begin grading) must be complete.
Data
All directions in this assignment open in a new tab.
- Login and open StatCrunch ().
- Open your IAT sample data set in StatCrunch ().
Variables
Gender-Career IAT Variables
Gender-Career IAT (opens in a new tab).
Gender-Science IAT Variables
Gender-Science IAT (opens in a new tab).
Race IAT Variables
Race IAT (opens in a new tab).
Sexuality IAT Variables
Sexuality IAT (opens in a new tab).
Weapons IAT Variables
Weapons IAT (opens in a new tab).
Weight IAT Variables
Weight IAT (opens in a new tab).
Prompt
You are tasked with using StatCrunch and your unique IAT sample to estimate the population mean for your IAT-Score variable.
Question 1
- Use StatCrunch and your unique IAT sample to estimate the mean IAT-Score for the population of IAT participants at the 80% confidence level (). Copy the contents of your StatCrunch output window and paste it into your response.
- Identify the 80% confidence interval.
- Interpret your confidence interval in context.
- Can we use the StatCrunch output to find the margin of error (MOE)? If so, what is the MOE? If not, identify the missing information.
Question 2
- Use StatCrunch and your unique IAT sample to estimate the mean IAT-Score for the population of IAT participants at the 95% confidence level (). Copy the contents of your StatCrunch output window and paste it into your response.
- Identify the 95% confidence interval.
- Interpret your confidence interval in context.
- Can we use the StatCrunch output to find the margin of error (MOE)? If so, what is the MOE? If not, identify the missing information.
Question 3
- Which of the two confidence intervals is more accurate? Briefly explain.
- Which of the two confidence intervals is more precise? Briefly explain.
-
Hi pleas I need help for my homework
Progress Check
Use this activity to assess whether you and your peers can:
- If conditions are met, use the ANOVA F-test to examine the relationship between a categorical explanatory variable that has more than two values and a quantitative response variable.
- State the conclusion of an ANOVA F-test in context.
Directions
Use the drop-down menu to learn about the three steps needed to complete this assignment.
Three steps to complete the assignment
Step 1: Review the Rubric
- Before you submit your work, review the rubric at the bottom of this assignment.
- Use the rubric as a checklist to determine whether you are ready to submit your work.
Step 2: First Draft
- Commit a good-faith effort to address each item in the Prompt section below.
- Please be sure to number your responses and include “white space” between problem numbers. This improves the readability and flow of your work. I cannot give feedback and grade jumbled work.
- Use either of the following options to submit your work.
OPTION 1: You can submit a text-entry assignment (i.e. typing your answers in Canvas). To learn how to submit a text-entry assignment, use these (opens in a new tab).
OPTION 2: You can upload your paper-and-pencil work (or the digital equivalent). To learn how to upload your paper-and-pencil work, use these (opens in a new tab). WARNING – some file types may not be visible on my end. So to learn which files you can upload, be sure to use the directions link I provided for this option. - Not ready to submit a good-faith effort yet? Avoid frustration – use the link to the Questions, Answers, & Tips discussion board (at the bottom of this page) to post questions about this assignment (or visit the discussion board to answer your classmates’ questions). You can also contact me directly (see the homepage for my contact information).
Step 3: Optional Final Draft
- After you submit your good-faith attempt to fully respond to the questions in the Prompt section below, advance to the ANSWER(S) page.
- You can use the ANSWER(S) page to correct your work and resubmit this assignment any time before I begin grading the problems. However, to earn full credit, you are not required to submit a final draft for this assignment. But if you do submit a final draft, I will only grade it if you submitted a good-faith effort on your first draft.
- Warning – I will only grade your most recent submission. So if you choose to submit a final draft, please do not leave anything out, and please do not direct me to read an earlier submission. To maximize your score, your most recent submission (at the time I begin grading) must be complete.
Context
Critical flicker frequency (CFF) and eye color
Computer screens and fluorescent bulbs flicker. If the frequency of the flicker is below a certain threshold, the eye detects the flicker, and it is annoying!
Different people have different flicker “threshold” frequencies (known as the critical flicker frequency, or CFF). The mean critical threshold frequency is important for product manufacturing as well as tests for ocular disease.
In 1973, researchers conducted a study to answer the following question.
Research question: Do people with different eye color have different threshold flicker sensitivity?
The 1973 study (“The Effect of Iris Color on Critical Flicker Frequency,” Journal of General Psychology [1973], 9195) obtained the following data from a random sample of 19 subjects.
Critical Flicker Frequency Color Threshold
Frequency (CFF)Blue Brown Green Brown 26.8 25.7 26.8 26.4 Brown 27.9 27.2 27.9 24.2 Brown 23.7 29.9 23.7 28 Brown 25.0 28.5 25 26.9 Brown 26.3 29.4 26.3 29.1 Brown 24.8 28.3 24.8 Brown 25.7 25.7 Brown 24.5 24.5 Green 26.4 Green 24.2 Green 28.0 Green 26.9 Green 29.1 Blue 25.7 Blue 27.2 Blue 29.9 Blue 28.5 Blue 29.4 Blue 28.3 In this spreadsheet the data is presented in two formats.
Stacked data: The quantitative data is stacked in one column. The first two columns show the data in a stacked format. Each variable is a column (one column for the explanatory variable eye color; one column for the response variable CFF) and each row is an individual. For example, the first row is a brown-eyed person with a CFF of 26.8.
Unstacked data: The quantitative data is distributed across the groups in multiple columns. The last three columns show the same data in an unstacked format. In this format, each column is a group defined by a value of the explanatory variable: one column for blue-eyed people, one column for brown-eyed people and one column for green-eyed people. Each column contains the response values (CFF) for that group.
The format of the data in the spreadsheet affects how we use StatCrunch to analyze it.
Variables
Color: This is the explanatory variable. The categorical data represents the groups we will compare.
CFF (flicker threshold sensitivity): This is the response variable. The quantitative data represents the frequency threshold at which the subject sees the flicker.
Data
- Open the flicker data set in the Stats at Cuyamaca College group on StatCrunch ( – opens in a new tab).
Prompt
We will conduct an ANOVA F-test for the variables Color and CFF. The flicker datafile is available in the Data section above. Also, the StatCrunch directions are provided in the list a the bottom of this page.
- What are the hypotheses for the ANOVA test? Be sure that you clearly define the parameters.
- Are the conditions that allow us to safely use the ANOVA F-test met? Explain and provide any supporting evidence.
Hint: The sample sizes are small. Therefore, to verify conditions, you will need to examine the shape of the distribution of CFF scores for each sample. - Use StatCrunch to create side-by-side dotplots, histograms or boxplots (your choice) to examine the distribution of CFF scores for each sample. You can use either data format; choose one (stacked data in the first two columns; or unstacked data in the last three columns). To create the side-by-side graphs (for either data format) see the list of StatCrunch directions below. Download the StatCrunch output window and embed it in the textbox with your responses. To recall how to complete these tasks, see the list of StatCrunch directions below.
- You will also need to compare the sample standard deviations. Use StatCrunch to find the descriptive statistics, means, and standard deviations for the comparison groups (select the appropriate Descriptive Statistics StatCrunch directions from the list below). Then copy and paste the table into the textbox and explain how the rule of thumb for comparing standard deviations is met.
- Use StatCrunch to carry out the ANOVA F-test (select the appropriate ANOVA StatCrunch directions from the following two options).
OR
Copy and paste the output table into the textbox.
- State your conclusion in context of eye color and mean CFF.
List of StatCrunch Directions
Click here for StatCrunch Directions
Each link will open in a new window. To return to this assignment, either close the new tab or select the tab for this assignment.
- (no screenshots; please use these directions)
- (no attachments; please use these directions)
Module 24 Discussion Board
Use the Module 24 (opens in a new tab) to ask questions or provide feedback about the problems in any Module 24 activity – including this peer-reviewed assignment.
Review Feedback
- Instructor feedback is only available after an assignment is graded.
- Use these (opens in a new tab) to learn how to review feedback.
Click the “Next” or > button to continue.
Content by Cuyamaca College math faculty and licensed under the .
Rubric
Formative Assessments w/ StatCrunch
Formative Assessments w/ StatCrunch
Criteria Ratings Pts This criterion is linked to a Learning OutcomeAnswering the Prompt
8 pts
This criterion is linked to a Learning OutcomeStatCrunch
2 pts
Total Points: 10
-
discussion post
You must submit your initial post FIRST before you can view and respond to your classmates’ initial posts.
Use the course Excel spreadsheet to construct a 90% confidence interval for proportion research
- Find the average price of homes in your state (cite your source).
- Gather a Sample: Record the prices for 15 randomly selected homes in your state. (Check Zillow.com or Realtor.com).
Construct the confidence interval using Excel
- Use your sample to construct a 90% Confidence Interval for the “Proportion of homes that have a price ABOVE the average price of the state.”
a). Verify that the sampling distribution of this proportion can be approximated by a normal distribution. If a normal distribution cannot be used, gather more data to satisfy the requirement.
b). Enter the Confidence Level (0.90), ‘n’ (Sample Size), and ‘x’ (Number of Successes) in the Week 6 Excel Spreadsheet.
c). From the Excel Spreadsheet: Identify the point estimate p, the critical value Zc, the Margin of Error, and the Lower and Upper Limits of the Confidence Interval. (Round all values to 2 decimal places.)
d). Provide a screenshot of the Excel spreadsheet displaying steps b) and c).
e). Explain how the Point Estimate and the Margin of Error are used to find the Lower and Upper Limits.
Interpret the Confidence Interval (23 Sentences)
- State your Confidence Interval and explain what it means. Explain as if you were talking to someone who has not taken statistics.
you need to pick a home in michigan and base it off of michigan in america
-
unit 6 & 7
Progress Check
Use this activity to assess whether you can:
- Describe the sampling distribution for sample proportions and use it to identify unusual (and more common) sample results.
- Distinguish between a sample statistic and a population parameter.
- Use StatCruch to find a confidence interval to estimate a population proportion when conditions are met.
- Interpret the confidence interval in context.
- Interpret the meaning of a confidence level and relate it to the margin of error when testing a claim.
- Given a claim about a population, determine the null and alternative hypotheses.
- Conduct a hypothesis test for a population proportion and state a conclusion in context.
- Interpret the P-value as a conditional probability.
- Recognize type I and type II errors and articulate the consequence of either error.
Directions
WARNING: The directions for Unit Projects differ from the directions for homework and lab assignments.
Use the drop-down menu to learn about the four steps needed to complete this assignment.
Four steps to complete the assignment
Data
For the remainder of this assignment, all links open in a new tab.
- Login and open StatCrunch ().
- Open your IAT sample data set in StatCrunch ().
Prompts
Each IAT data set has a different prompt for this project. Select the appropriate drop-down triangle below to see the prompt for your data set.
Race IAT Questions & Variables
Open for the Race prompt
Question 1 and Question 2 use different variables. For each question, you can find a description of the indicated variable on this Race IAT page.
Question 1
The variable for this question is Crime-Equal.
-
-
- Which IAT data set are you working with?
- Use StatCrunch to find the 95% confidence interval that estimates the population proportion of Race IAT participants who moderately agree that law enforcement officers should act as if members of all racial groups are equally likely to commit crimes (). Highlight and copy everything in your StatCrunch output window and paste it into your response.
- Identify the sample proportion in your StatCrunch output table. Then determine whether conditions are met for using the confidence interval to estimate the population proportion of participants in your chosen IAT. (Be sure to support your answer as demonstrated in Units 6 and 7.)
- If conditions are met, estimate the population proportion of participants in your particular IAT, and state your conclusion in context. If conditions are not met, explain what a researcher could do so that conditions are met.
- Based on your analysis, do you think the population of participants in your chosen IAT is representative of the U.S. population? Explain.
-
Question 2
The variable for this question is Race.
Question to be investigated: According to the United States Census Bureau, in 2019 approximately 13.4% of the U.S. population identified themselves as black. Is the proportion of black participants lower for your chosen IAT?
Respond to each of the following.
-
-
- State your hypotheses in symbolic form and in words. (The population of interest and the meaning of the proportion in terms of the variable Race should be clear in your answer.)
- StatCrunch uses a normal model to estimate the -value probability. Are the normality conditions met? Show your work.
- Use StatCrunch to conduct the hypothesis test (). Copy and paste the results (the StatCrunch output window) into the textbox.
- Give your -value and interpret its meaning as a conditional probability.
- State a conclusion that answers the research question. Use a significance level of 5%. (Your answer should include the -value and reference the population and the appropriate variable.)
-
Question 3
We cannot know whether a Type 1 or Type 2 error actually occurs in a hypothesis test. But, based on the results of our hypothesis test, we should be aware of which type of error is possible and what that error means in the context of our test.
-
-
- For the hypothesis test, you conducted in Question 2, which type of error is possible, Type 1 or Type 2? Briefly explain why.
- In the context of your hypothesis test, interpret the type of error you identified in part a).
-
Weapons IAT Questions & Variables
Open for the Weapons prompt
Question 1 and Question 2 use different variables. For each question, you can find a description of the indicated variable on this Weapons IAT page.
Question 1
The variable for this question is Therm-Black.
-
-
- Please state the IAT data set you are working with.
- Use StatCrunch to find the 95% confidence interval that estimates the population proportion of Weapons IAT participants who indicate that they feel neither warm nor cold toward black Americans (). Highlight and copy everything in your StatCrunch output window and paste it into your response.
- Identify the sample proportion in your StatCrunch output table. Then determine whether conditions are met for using the confidence interval to estimate the population proportion of participants in your chosen IAT. (Be sure to support your answer as demonstrated in Units 6 and 7.)
- If conditions are met, estimate the population proportion of participants in your particular IAT, and state your conclusion in context. If conditions are not met, explain what a researcher could do so that conditions are met.
- Based on your analysis, do you think the population of participants in your chosen IAT is representative of the U.S. population? Explain.
-
Question 2
The variable for this question is Race.
Question to be investigated: According to the United States Census Bureau, in 2019 approximately 13.4% of the U.S. population identified themselves as black. Is the proportion of black participants lower for your chosen IAT?
Respond to each of the following.
-
-
- State your hypotheses in symbolic form and in words. (The population of interest and the meaning of the proportion in terms of the variable Race should be clear in your answer.)
- StatCrunch uses a normal model to estimate the -value probability. Are the normality conditions met? Show your work.
- Use StatCrunch to conduct the hypothesis test (). Copy and paste the results (the StatCrunch output window) into the textbox.
- Give your -value and interpret its meaning as a conditional probability.
- State a conclusion that answers the research question. Use a significance level of 5%. (Your answer should include the -value and reference the population and the appropriate variable.)
-
Question 3
We cannot know whether a Type 1 or Type 2 error actually occurs in a hypothesis test. But, based on the results of our hypothesis test, we should be aware of which type of error is possible and what that error means in the context of our test.
-
-
- For the hypothesis test, you conducted in Question 2, which type of error is possible, Type 1 or Type 2? Briefly explain why.
- In the context of your hypothesis test, interpret the type of error you identified in part a).
-
Weight IAT Questions & Variables
Open for the Weight prompt
Question 1 and Question 2 use different variables. For each question, you can find a description of the indicated variable on this Weight IAT page.
Question 1
Your assigned variable is Prefers.
-
-
- Please state the IAT data set you are working with.
- Use StatCrunch to find the 95% confidence interval that estimates the population proportion of Weight IAT participants who indicate that they like thin people and fat people equally (). Highlight and copy everything in your StatCrunch output window and paste it into your response.
- Identify the sample proportion in your StatCrunch output table. Then determine whether conditions are met for using the confidence interval to estimate the population proportion of participants in your chosen IAT. (Be sure to support your answer as demonstrated in Units 6 and 7.)
- If conditions are met, estimate the population proportion of participants in your particular IAT, and state your conclusion in context. If conditions are not met, explain what a researcher could do so that conditions are met.
- Based on your analysis, do you think the population of participants in your chosen IAT is representative of the U.S. population? Explain.
-
Question 2
The variable for this question is Race.
Question to be investigated: According to the United States Census Bureau, in 2019 approximately 13.4% of the U.S. population identified themselves as black. Is the proportion of black participants lower for your chosen IAT?
Respond to each of the following.
-
-
- State your hypotheses in symbolic form and in words. (The population of interest and the meaning of the proportion in terms of the variable Race should be clear in your answer.)
- StatCrunch uses a normal model to estimate the -value probability. Are the normality conditions met? Show your work.
- Use StatCrunch to conduct the hypothesis test (). Copy and paste the results (the StatCrunch output window) into the textbox.
- Give your -value and interpret its meaning as a conditional probability.
- State a conclusion that answers the research question. Use a significance level of 5%. (Your answer should include the -value and reference the population and the appropriate variable.)
-
Question 3
We cannot know whether a Type 1 or Type 2 error actually occurs in a hypothesis test. But, based on the results of our hypothesis test, we should be aware of which type of error is possible and what that error means in the context of our test.
-
-
- For the hypothesis test, you conducted in Question 2, which type of error is possible, Type 1 or Type 2? Briefly explain why.
- In the context of your hypothesis test, interpret the type of error you identified in part a).
-
StatCrunch Directions
Here is a PDF document with all .